 ImmuCast 5.17.4 User Guide ImmuCast 5.17.4 User Guide |
SOAP Monitor
STC does not include a SOAP monitor tool with ImmuCast.
However, open source testing tools are available for download on various
websites. One such tool is soapUI, which is a free and open-source cross-platform
functional testing solution. This is not provided by STC, but is available
for download at https://www.soapui.org/.
- Download and install the correct version of
soapUI for your environment from https://www.soapui.org/.
- Start the application. The start page can be
closed.
- Create a new project by clicking (CTRL-n)
or select File
> New soapUI Project.
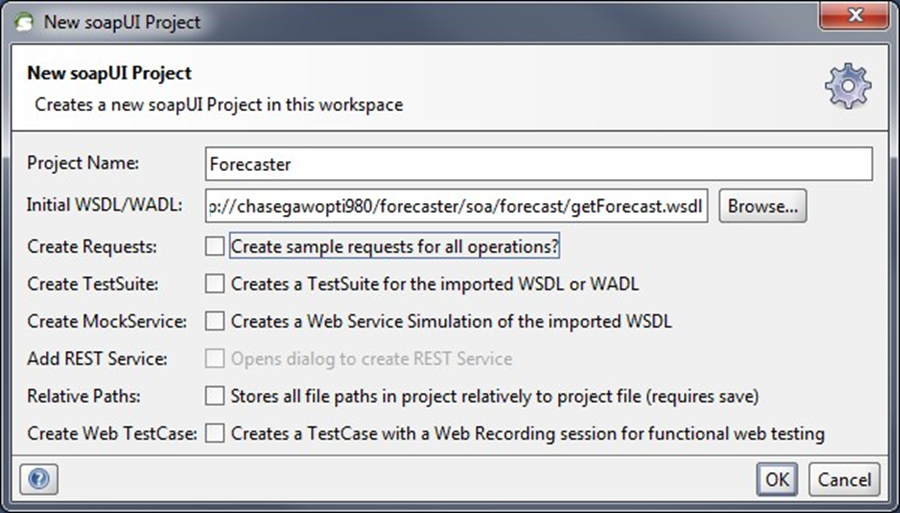
- Enter a Project
Name.
- Enter the WSDL
URL.
- Remove the checkmark from the Create Requests option.
- Click OK.
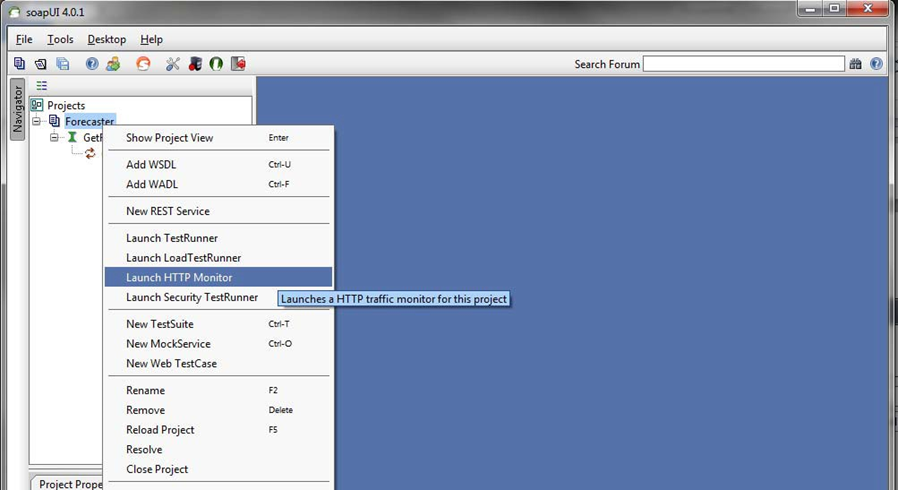
- Right-click on the newly created project and
select the Launch HTTP Monitor option from the menu (shown below).
- The forecasting service must be run through
port 80 to use soapUI (shown below).
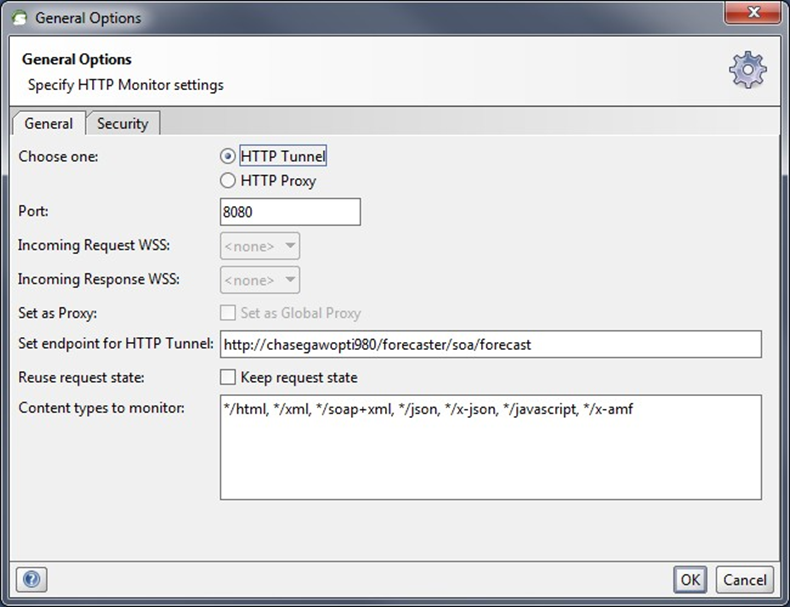
- Specify HTTP
Tunnel.
- Select an available Port.
- Set the Endpoint
as the URL that would normally be called.
- Click OK.
- This is used to set up a new URL for sending messages through
- soapUI forwards the messages to the actual service, records
the request and responses, and then returns the result
- On the Forecaster Tester page (shown below),
change the URL to point to the new soapUI URL. For example, your ImmuCast URL might normally
be: http://localhost:8082/immucast-test/soa/forecast.
- On the Tester page, change the URL also (assuming
you used port 8080):
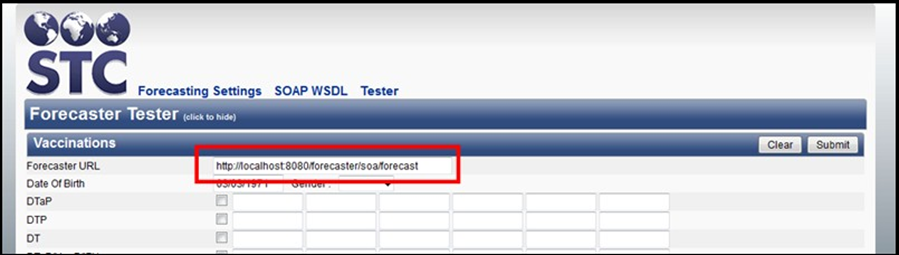
- Submit your data.
![Example traffic log on the HTTP Monitor [Forecaster] page](images/appb_soap_06.png)
- Your monitor should show the message being
received. Highlight the row and click the first button on the toolbar
to create a request from the data sent.
![Toolbar buttons on the Traffic Log tab on the HTTP Monitor [Forecaster] page](images/appb_soap_07.png)
- On the left side, you should now see a new request.
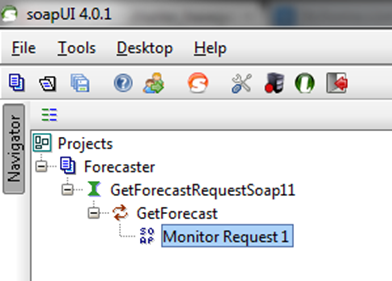
- Double-click Monitor
Request to open the editor. To see formatted XML, press ALT+F or right-click in the text
area and select the Format
option.
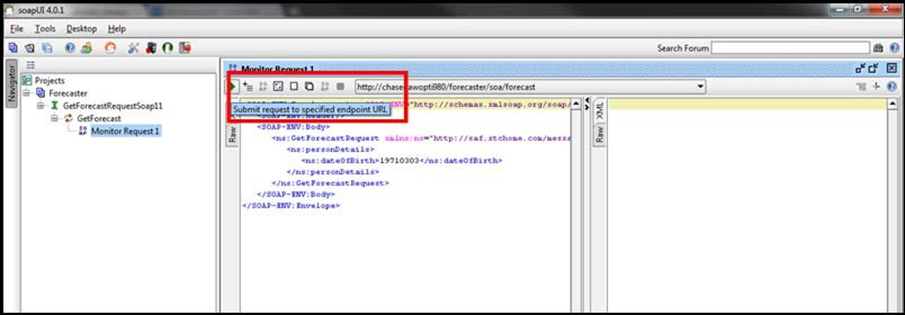
- At this point, you can optionally choose to
edit the request. You can also submit the request (modified or not)
by clicking the Submit button
(the first button on the toolbar).
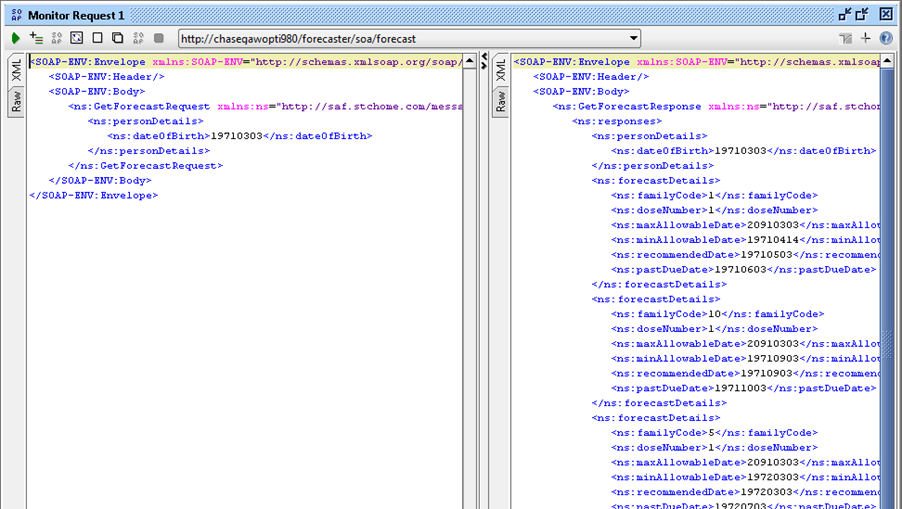
- The response is shown in the right-hand pane.
Related
Topics: