|
|
This page is only available to AFIX Coordinators and AFIX users.
The Adolescent Master Rate Comparison report displays providers in order of coverage rates (excluding influenza) as they relate to the Adolescent Cohort (ages 13 through 17 years). The displayed list is only a preview of the list; the report must be exported in order to view the full list. (For example, the full list contains every provider within the user's state that serves adolescents in that age range. It also provides additional information such as the provider's county.) The report can be printed or exported.
To access the Adolescent Master Rate Comparison report, click the Master Rate > Adolescent menu link. The Adolescent Master Rate Comparison page opens with the results displayed on the page.
The information that displays at the top of the page includes:
The following information displays on the page. Again, the page displays only a partial list - export the data for more details (see below for more information about exported fields).
| Field | Description |
Provider Name |
The name of the provider. |
VFC PIN |
The provider's VFC PIN. |
IIS ID |
The provider's IIS ID number. |
% UTD for Measure |
The percentage of up-to-date patients. |
(# UTD / Childhood Records) |
The number of up-to-date patients versus the total number of assessed records at that practice. |
|
Indicates the provider has a low number of up-to-date patients. Note that this image appears on the screen only and if the list does not show the bottom quartile because it is truncated, the image may not appear at all. |
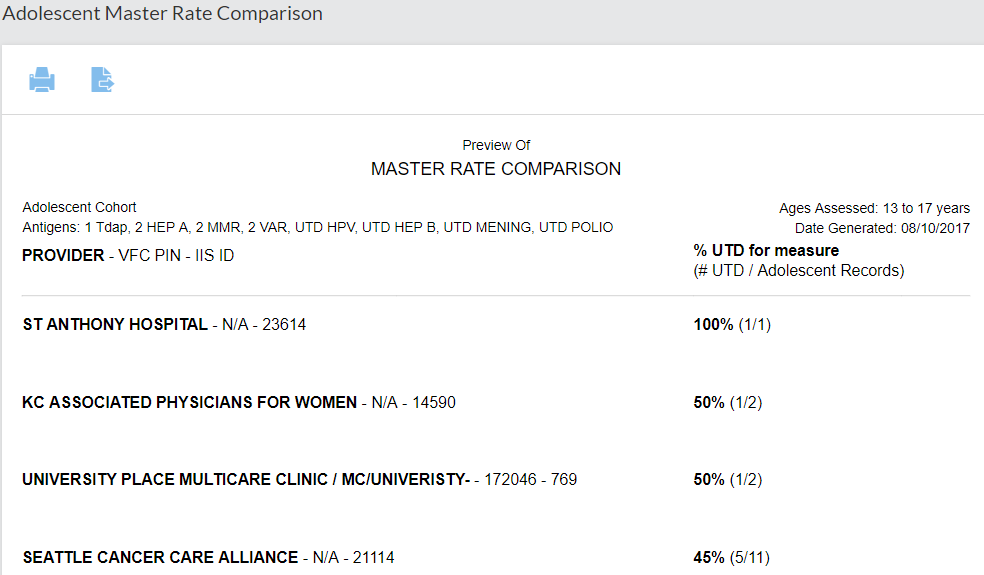
The image below is an example report displayed on the Adolescent Master Rate Comparison application page for a fictional organization:
When exported, the CSV and XLS formatted files contain the following fields:
| Field | Description |
Provider Name |
The name of the provider. |
VFC PIN |
The provider's VFC PIN. |
Provider ID |
The provider's IIS ID number. |
County |
The provider's county. |
UTD Count |
The number of patients that are up-to-date. |
Patient Count |
The total number of patients at this practice. |
UTD % |
The percentage of patients that are up-to-date with vaccinations. |
Provider Rank |
The rank of the provider compared to all of the providers in the state (example: 23/764, meaning the provider is ranked 23rd out of 764 providers in the state). |
Quartile |
The quartile into which the provider falls. Quartile 1 is the top 25%; quartile 4 is the bottom 25%. |
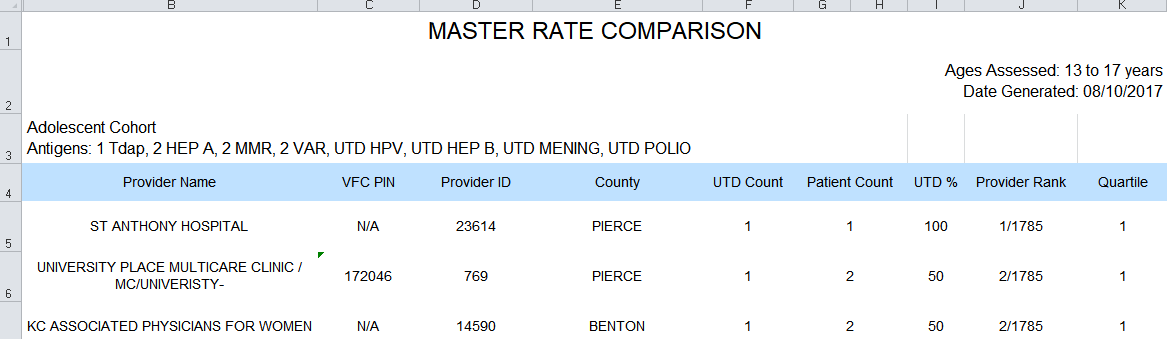
The image below shows an example of how the Adolescent Master Rate Comparison report might appear when exported as an XLS file:
To print the report, click the printer icon ( ) and
follow the prompts to select a printer and options.
) and
follow the prompts to select a printer and options.
To export the data to a file, click the export icon ( )
and then click the type of file format to export as. Note that graphs
can only be exported in PDF format, while table view data can be exported
as a CSV or XLS formatted file.
)
and then click the type of file format to export as. Note that graphs
can only be exported in PDF format, while table view data can be exported
as a CSV or XLS formatted file.
