 VOMS Organization/Facility
Client User Guide (v. March 2018)
VOMS Organization/Facility
Client User Guide (v. March 2018)|
|
 VOMS Organization/Facility
Client User Guide (v. March 2018) VOMS Organization/Facility
Client User Guide (v. March 2018) |
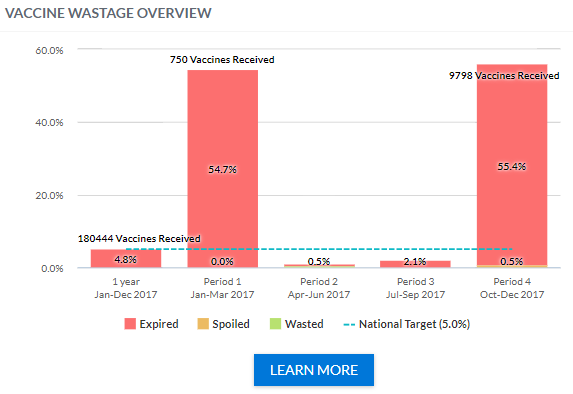
The Vaccine Wastage Overview graph that displays on the VOMS dashboard allows authorized users to easily view and keep track of vaccine wastage, as well as assess progress in reducing the facility's vaccine wastage. Expired, wasted, and spoiled vaccines are shown.
Registry Client users must have the Provider Ordering User and Lot Number Manager permissions. Organizations and facilities must have the Allow online orders option enabled.
Only public inventory is included in the calculation for the graph. Note that if an organization/facility is not selected in the search bar, no data displays on the page.
The graph is calculated and displayed according to the following circumstances:
The graph is updated at the end of every month and contains information for the 12 previous months. The oldest month drops off as the graph is updated, so that only 12 months of data is included.
The following image shows the actual calculations used for determining expired, wasted, and spoiled percentages:

If no vaccines were received during a specific time period, a bar is not present on the graph for that time period.
Click the Learn More button under the graph to go to the Aggregate Wastage Report parameters page in IWeb and run the report. See Aggregate Wastage Report.
Example Vaccine Wastage Overview graph:

 |