|
|
This page is available to both State users and Organization/Facility users after a provider begins submitting HL7 data. The organization/facility must be indicated in the search bar first, before clicking on the link. (State users can select the organization/facility on the Provider List page instead.)
To open the Data Quality Assessment Tool page, click the DQA menu link.
This DQA tool lists each HL7 data element separately and categorizes how many messages contain errors and warnings for each data element. An easy-to-understand graph is available, along with detailed reasons for the errors and warnings. After troubleshooting, each one can be marked as fixed.
In order to display the report, select the report parameters (listed below) and click Search.
The filters and icons available in the filter section are as follows:
| Filter/Icon | Description |
Pre-Production / Production filter |
If the iQ application is being used in pre-production, select Pre-Production from the drop-down list. Otherwise, if the iQ application has moved to production, select Production. The data that is retrieved and displayed on this page depends on whether or not the application is "live" (in Production) or not (Pre-Production). |
Print icon |
|
Export icon |
|
Filter icon |
If the filter section is hidden, click
the gray Filter icon |
Filter by |
Select the filter options from these drop-down lists:
Also select one of these HL7 Message Locations (optional):
Additional filters (slide the slider to select the filter option you want):
|
Search |
Click this button to submit the filter criteria and display the search results. |
Reset |
Click this button to reset all of the filter criteria to start over again. |
After the filters have been submitted, the search results appear in the following sections. Click a section name to open it and view the details. Example sections include:
In each section is a summary of information (for example, total number of segments, fields, and components received, total number of HL7 messages with successful transactions, message success rate percentage, total number of messages with failed transactions, and failure rate percentage) and then more detailed information for each data element.
The available columns are the same for each section of information:
| Column | Description |
HL7 Data Element |
The name of the HL7 data element. Until a section is opened, the category name is displayed:
After the section is opened, the individual HL7 data elements for that section are displayed. |
HL7 Code |
The HL7 code for the data element. |
Success (Rate) |
The number (and percentage, rounded up to the next whole number) of HL7 fields that did not contain an error (for this HL7 data element). |
State Expectation |
The state-expected success rate (as a percentage) for this HL7 data element. |
Score |
The Pass/Fail score for this HL7 data element, based on the following criteria:
|
Errors (Rate) |
The number (and percentage) of HL7 fields that contained an error for this HL7 data element. If errors were found, click the link in this column to view the Reason for Failure graph for this data element. |
Warnings (Rate) |
The number (and percentage) of HL7 fields that contained a warning for this HL7 data element. If warnings were found, click the link in this column to view the Reason for Failure graph for this data element. |
The state expectation rate and error/warning recommendations are configured in the administration settings section. See DQA Administration.
For each data element, if there were one or more errors or warnings, the number and percentage become links to the Reason for Failure graph for that item. Click the link to open the Reason for Failure graph and view the details. Users can also mark items that have been fixed.
The Reason for Failure graph shows a pie chart with each type of error or warning displayed as a different color and the detailed information displayed below the graph. Here is an example Reason for Failure graph:
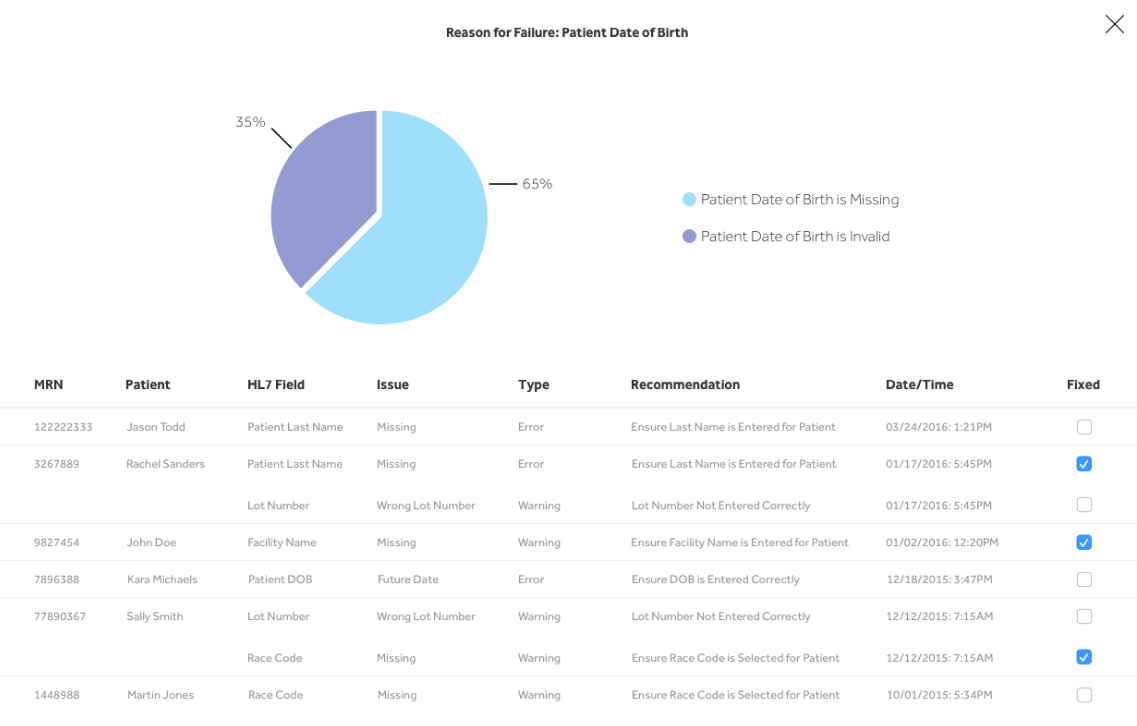
Mark each fixed item and close the graph when finished.
 Apply the filters or search for specific action items, then
click the
Apply the filters or search for specific action items, then
click the  Apply the filters or search for specific action items, then
click the
Apply the filters or search for specific action items, then
click the  to open it. The
  when
the filter section on the page is open. Click the blue
when
the filter section on the page is open. Click the blue