The Childhood Coverage Rate Report page displays the coverage rate information for the Childhood Cohort (age 24 through 35 months) for the specific facility selected in the search bar.
To access this report, first select the facility in the search bar (if necessary), then click the Childhood > Coverage menu link. The Childhood Coverage Rate Report page opens in graph view. The graph displays the childhood assessment data for the selected facility and displays how the facility ranks for the relevant cohort among other facilities within the state (for example, 228 of 1554 providers). For each antigen or series, the number and percentage of patients that are up-to-date, late up-to-date, and missed opportunities are displayed.
 The graph on the top of this page is an aggregate of the relevant antigens for the cohort, excluding flu, hepatitis A, and rotavirus. The graph on the top of this page is an aggregate of the relevant antigens for the cohort, excluding flu, hepatitis A, and rotavirus. |
To be counted as up-to-date in the top summary graph, the patient must be up-to-date for all relevant assessed antigens. To be counted as late up-to-date, the patient must have one or more late up-to-date antigens and be up-to-date for all other relevant assessed antigens. For example, if a patient is late up-to-date for MMR, missing the VAR, and up-to-date on everything else, they are not counted for the late up-to-date or the up-to-date measure.
The missed opportunities number in the summary graph indicates the number of patients with missed opportunities, not the number of missed opportunities. For example, if a patient has four missed opportunities, he is only counted once.
Note that flu coverage calculations are based on the most recently completed flu season, not a flu season in progress (defined as July 1st through June 30th). Missed opportunities for flu are based on the vaccination date during that season. On the missed opportunity patient list, the same patient may have a different last vaccination date listed for flu compared to other antigens. Flu calculations are included on both the Childhood Coverage Rate Report and on the Childhood AFIX Export. (Note that AFIX export is not available for independent states.)
The Filtering By section at the top displays how the report criteria were configured. The Childhood Coverage Rate Report criteria is pre-set as listed below.
| Filter Type | Criteria |
|
Provider |
The facility displayed in the top search bar. |
|
Ages Assessed |
24 through 35 months of age. |
|
As of Date |
The current date. |
|
Selected Cohort/Series/Antigens |
1 UTD refers to the term up to date for measurements where a variable number of doses can be applied based on age, date of first dose, and/or vaccine product licensure. |
|
Compliance by Age |
24 months |
|
Assessment Date |
The date of assessment. |
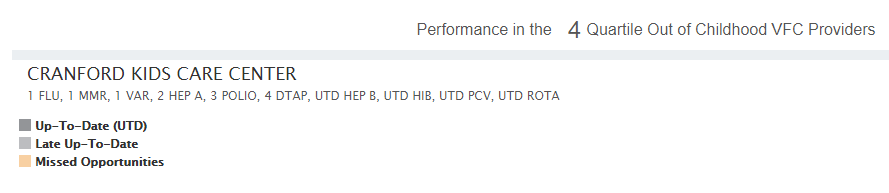
If the organization/facility is a top performer (in the top 10% for childhood coverage rates), an icon appears above the individual antigen graph. The organization/facility performance level also appears above the graph. (Note that there may be ties in ranking.) Example:
Click the Table View icon ( ) to display the data in a table. The columns in the table view are:
| Column | Description |
|
Antigen |
The specific antigen. The antigens include:
|
|
Up-to-Date % |
The percentage of total patients that are up-to-date on their vaccinations. |
|
Up-to-Date Count |
The number of patients that are up-to-date on their vaccinations. |
|
Late Up-to-Date % |
The percentage of total patients that are considered to be late up-to-date on their vaccinations. |
|
Late Up-to-Date Count |
The number of patients that are considered to be late up-to-date on their vaccinations. |
|
Missed Opportunity % |
The percentage of total patients that are considered to be missed opportunities, based on their last vaccination visit. |
|
Missed Opportunity Count |
The number of patients that are considered to be missed opportunities, based on their last vaccination visit. |
|
Total Patients |
The total number of patients for each antigen. |
|
Overall Childhood Completion (bottom row) |
A summary of each column, representing the overall childhood completion rate. |
To return to the graph view, click the Graph View icon ( ).
).
To print the report, click the Print icon ( ) and follow the prompts to select a printer and options. The Childhood Coverage Rate Report prints as it displays on the screen, in either graph or table view.
To export the data to a file, click the Export icon ( ) and then click the type of file format to export as. Note that graphs can only be exported in PDF format, while tables can be exported as CSV or XLS formatted files. To cancel the export process, click either the Cancel Export button or the X in the upper right-hand corner of the Exporting Report pop-up window.
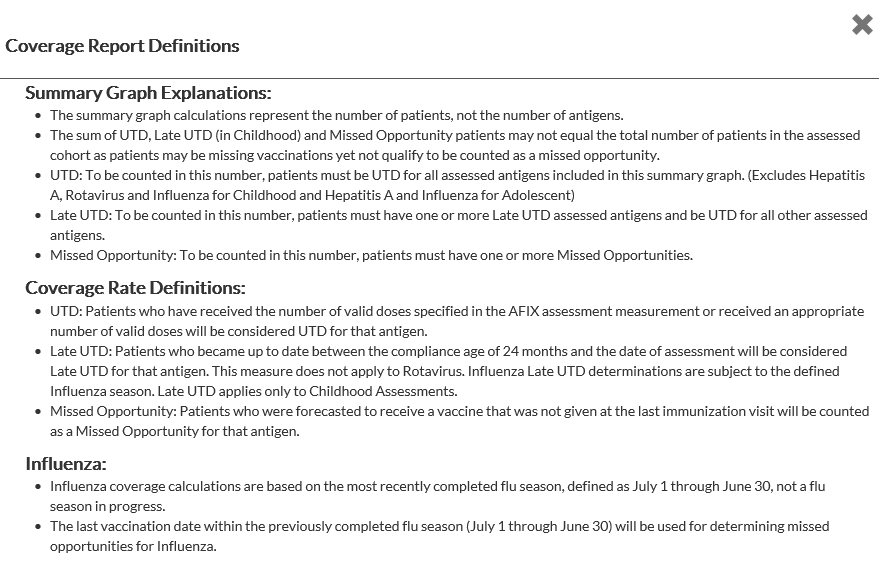
For addition information about what is displayed on the page and in the Coverage Rate reports, click the Coverage Report Definitions icon ( ). A pop-up opens with additional information, such as the example shown below: